House vs Senate: how congressional stock trade disclosures differ
Same statute, two systems. Comparing the House and Senate records explains a lot of the quirks you meet in any congressional trade tracker.
Volume and pace
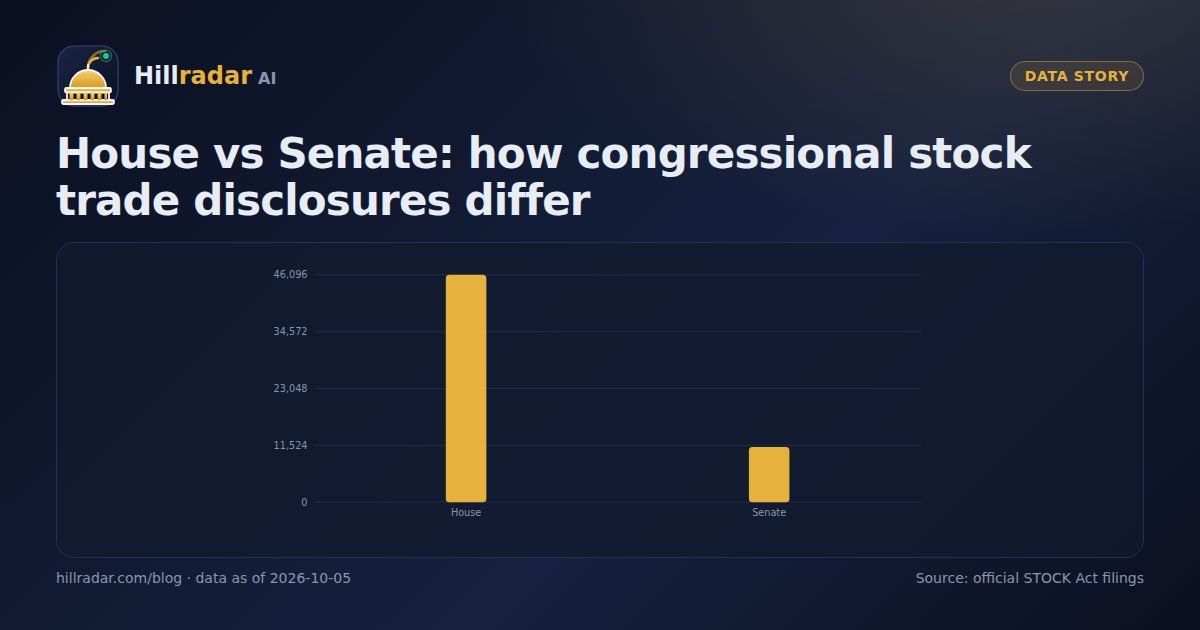
The House has filed 46,096 transactions and the Senate 11,166, a ratio of about 4.1 to 1. Per filer the difference almost disappears: 168 per representative versus 145 per senator. The House total is also more concentrated, with the three most active filers in the entire record all representatives.
Filing speed
Senators file faster. The average delay from trade to filing is 41.8 days in the Senate against 59.4 in the House, and the late rate (over 45 days) is 10.6% versus 15.5%. One reason is that the Senate eFD system is fully electronic with structured entry, while a share of House filings still arrive as scanned forms that take longer to process and publish.
Whose account
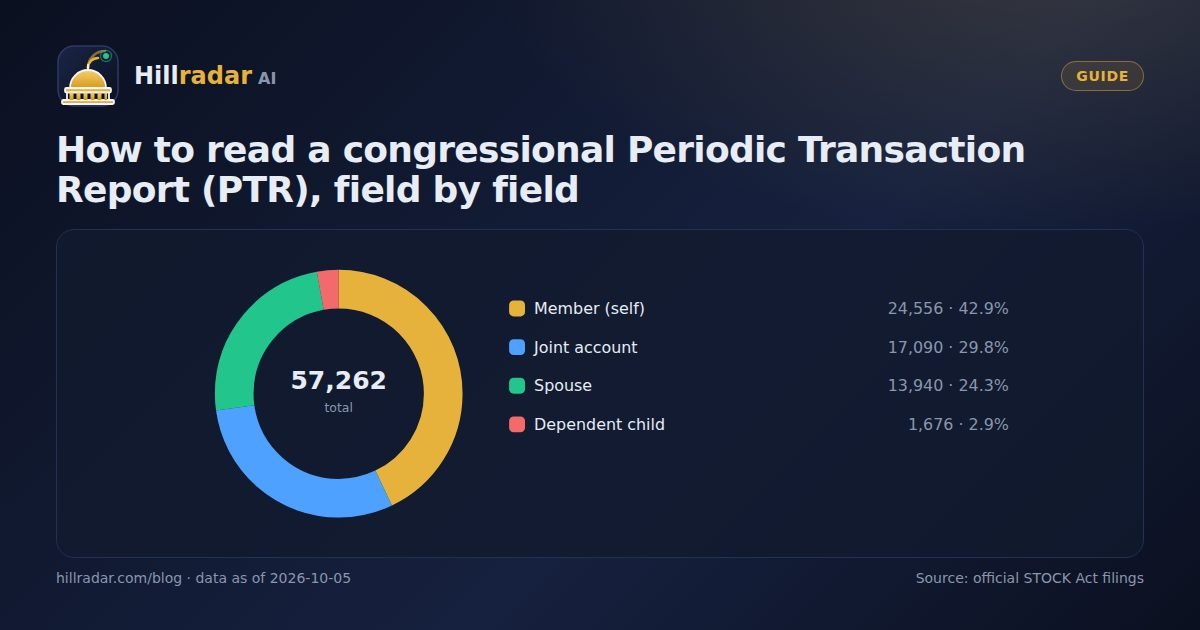
This is the sharpest difference. In the House, 48% of transactions are in the member's own name. In the Senate it is only 23%; spouse and joint accounts make up the large majority. Anyone attributing Senate trades to a senator's personal judgment should look at the owner column first.
File formats and what they mean for data
- House: PDFs per filing plus a yearly machine-readable index of who filed what and when. Scanned handwritten forms exist, especially in older years, and require OCR, which is where most parsing errors in any tracker originate.
- Senate: web forms in eFD since 2012 with structured fields for most filers, and scanned paper for a minority. Easier to parse, but the site is session-based and not designed for bulk access.
- Both: amendments replace nothing; they add a new filing, so trackers must de-duplicate by lawmaker, asset, date and amount.
What this means when you read a tracker
- House numbers dominate any all-Congress statistic; filter by chamber before comparing lawmakers.
- Senate filings are fresher on average, so a Senate alert is typically a few weeks closer to the trade.
- Most Senate transactions are spouse or joint; most House transactions are the member's own.
- Parsing quality differs by source; a good tracker links every row to its original filing so you can check.
Hillradar AI shows chamber, owner and filing delay on every record, and lets you filter by all three. Create a free account to compare the two chambers on live data, or read the full analysis of filing delays.
Per-year pattern by chamber
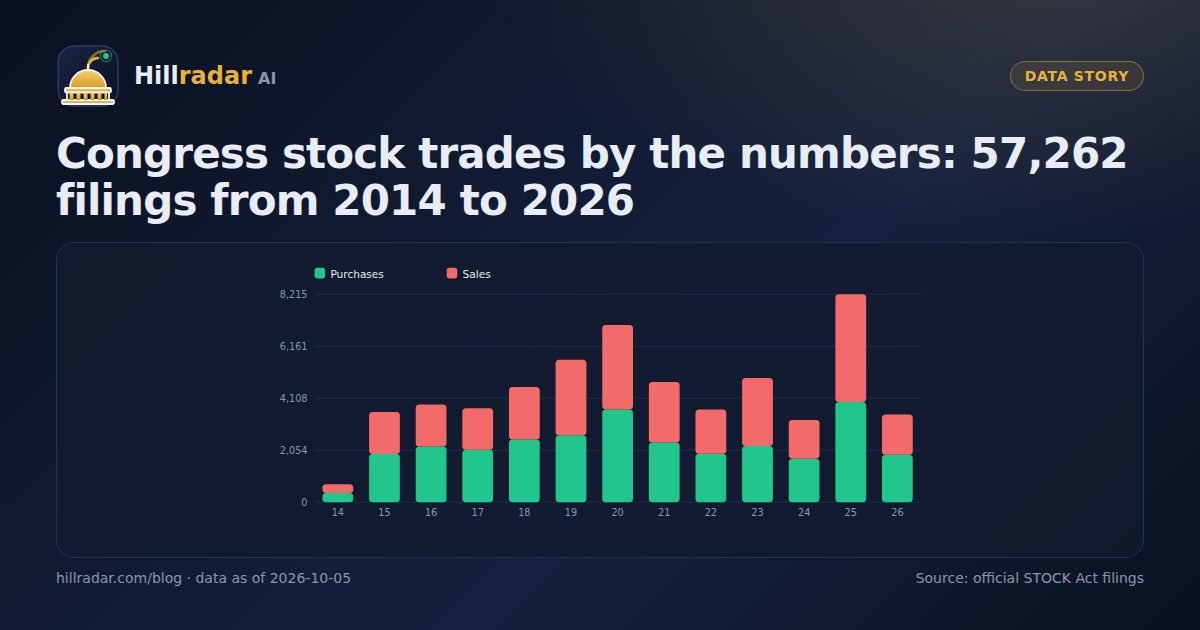
House volume is lumpier than Senate volume. The House produced the 2020 and 2025 spikes almost entirely by itself, because a few representatives with very active managed accounts joined or left during those years. The Senate's annual count has been steadier, partly because senators' six-year terms mean slower turnover in who is filing, and partly because so much Senate activity sits in spouse and joint accounts that trade less frequently. When a chart of "Congress" trading jumps, the first question to ask is which chamber, and usually which handful of members, moved it.
Committees and conflicts
The two chambers also differ in how disclosures interact with committee work. Senate committees are smaller and more senior, so a single senator's holdings in a regulated industry attract more scrutiny than a junior representative's. The House, with 275 filers in the record, offers more cases but each is harder to connect to specific legislative influence. Trackers help by making the overlap visible: Hillradar AI profiles show committee-relevant sectors alongside holdings so readers can judge for themselves. Neither chamber's rules currently prohibit trading in companies a member oversees; they require disclosure of it.
Practical tips for reading each chamber
- For House filings, check the delay in days first; the average is 59.4 and bundles of late trades are common.
- For Senate filings, check the owner code first; most transactions are spouse or joint.
- Use per-member averages (168 House, 145 Senate) rather than chamber totals when comparing individuals.
- When citing a filing, link to the original on the Clerk or eFD site; the two systems number and format documents differently.
Frequently asked questions
Where are House and Senate stock trade filings published?
House filings are published by the Clerk of the House on its Financial Disclosure site; Senate filings by the Secretary of the Senate through the electronic Financial Disclosure (eFD) system. Both are free and public.
Do senators trade less than representatives?
Per member the gap is modest: 145 transactions per senator versus 168 per representative since 2014. The much larger House total mostly reflects the number of members.
Why are so many Senate trades in spouse or joint accounts?
The Senate record has a higher share of transactions marked spouse or joint, which often reflects older members with long-established family holdings and managed accounts, rather than any difference in the rules.
Hillradar AI republishes public STOCK Act disclosures for research and education. Figures come from the official filings as collected in our database on the date shown; filings can be amended by the filer. Nothing here is investment advice.