Congress stock trades by the numbers: 57,262 filings from 2014 to 2026
We counted every Periodic Transaction Report in the record. The totals, the trends and the surprises, with charts drawn from the Hillradar AI database as of 2026-10-05.
The headline numbers
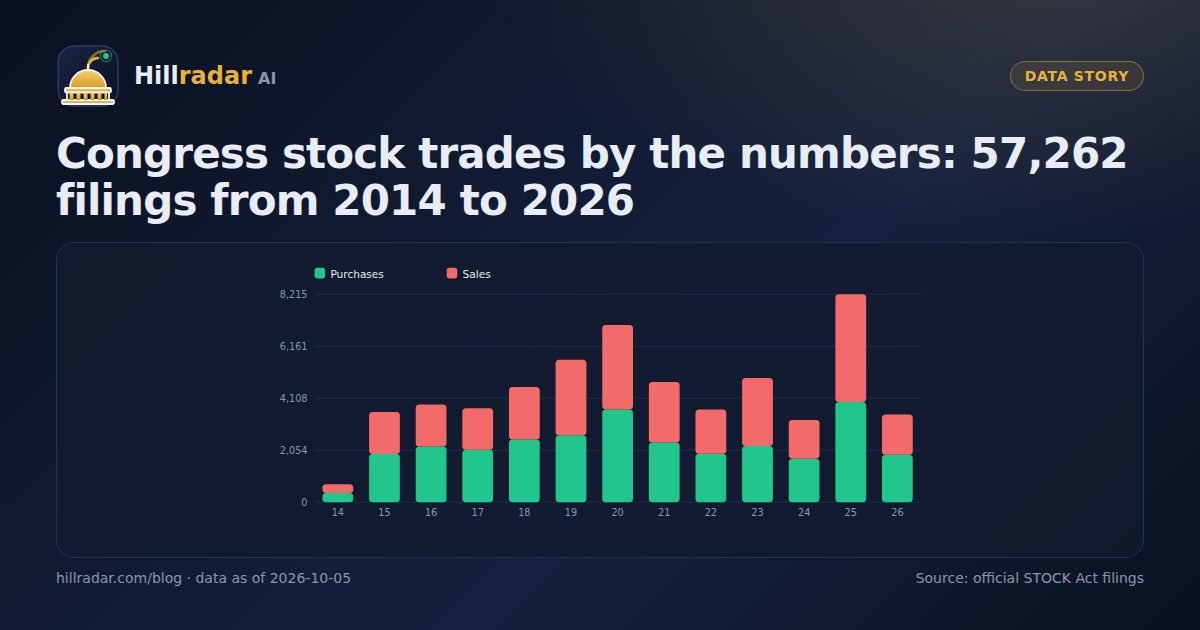
As of 2026-10-05 the Hillradar AI database holds 57,262 disclosed transactions by 352 current and former lawmakers across 9,742 companies and assets. 29,368 of them are purchases and 27,892 are sales, a near-even split that holds in most years.
Filings per year
Two peaks stand out. 2020, the pandemic year, produced 7,003 transactions as portfolios were repositioned in a volatile market. Then after a quieter 2021–2024, 2025 set a new record at 8,215, driven by a handful of very active filers and a large new freshman class. 2026 is on a similar pace.
By party
Republicans account for 51.4% of transactions and Democrats 48.3%. Per member, Democrats file slightly more often (about 187 transactions each versus 150), but the distribution is extremely skewed: the ten most active filers alone account for roughly a third of the entire record, so party averages say more about a few portfolios than about either caucus.
House versus Senate
The House produced 46,096 transactions (81%) and the Senate 11,166. Per member the gap is smaller: 168 filings per representative against 145 per senator. Senators do file faster, averaging 41.8 days from trade to filing against 59.4 in the House. We compare the two chambers in detail here.
States with the most trades
Not only stocks
17% of transactions involve assets without a stock ticker: 7,691 bond and Treasury trades, 2,727 fund and ETF trades, 1,113 options trades and 110 crypto transactions. The stock-only views on Hillradar AI exclude them; the "all assets" toggle on the dashboard brings them back.
- 57,262 transactions, 352 lawmakers, 9,742 assets since 2014.
- 2025 was the busiest year on record; 2020 was second.
- Party split is close by count; a few very active members drive most of the volume.
- The House files 4× as many transactions as the Senate but senators file faster.
All of these numbers update as new filings arrive. The live versions, filterable by lawmaker, company, date and amount, are on the Hillradar AI dashboard.
The last two years, month by month
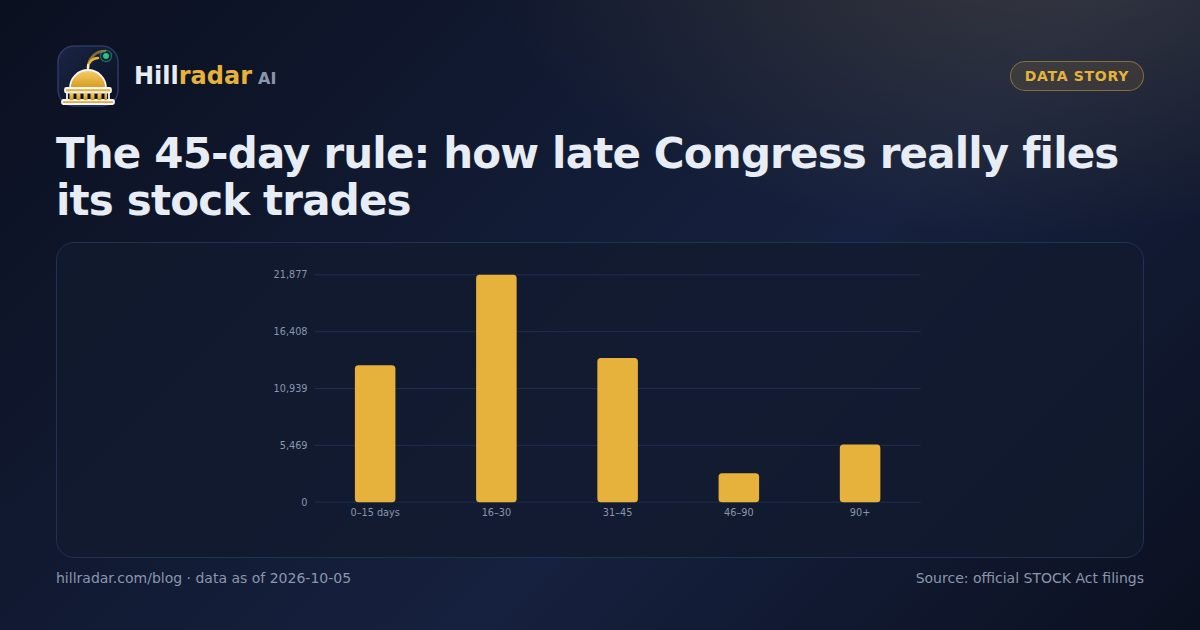
Zooming in on filing dates rather than trade dates shows how uneven publication is. The busiest month in the last two years saw 1,251 filings and the quietest full month 195, a 6× swing. Spikes line up with the ends of calendar quarters, when managed accounts rebalance and brokerage statements arrive, and with the May annual-report season, when members catch up on transactions they had missed. If you watch filings in real time, expect bursts rather than a steady stream, which is why alerts are more practical than refreshing the official sites.
Who drives the totals
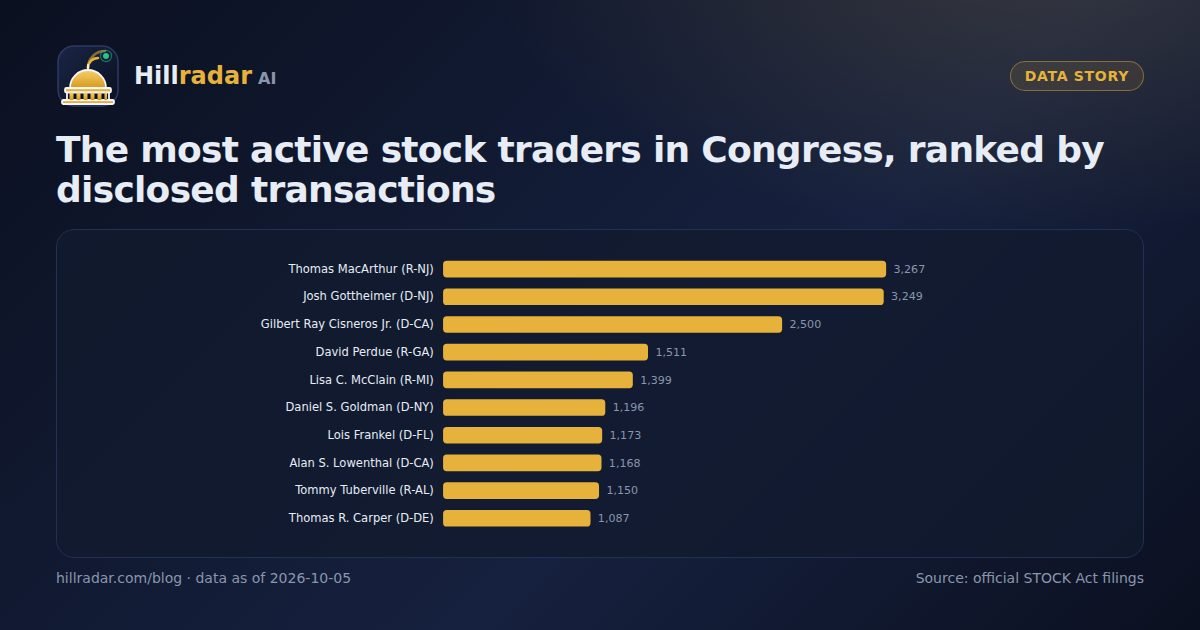
The 352 lawmakers in the record are not equal contributors. The three most active, Rep. Thomas MacArthur (3,267), Rep. Josh Gottheimer (3,249) and Rep. Gilbert Ray Cisneros Jr. (2,500), together filed 9,016 transactions, about 16% of everything. Meanwhile only 128 members disclosed a single trade in the past twelve months. Any statistic about "Congress" trading is therefore really a statistic about a few dozen active portfolios, most of them professionally managed. That does not make the aggregate meaningless, but it does mean per-lawmaker views are more informative than totals.
How big the trades are
Size tells the same story of concentration from a different angle. 69% of all transactions are in the $1,001–$15,000 band and a further 17% are $15,001–$50,000. Only 895 transactions in twelve years exceeded $500,000, and 62 exceeded $5 million. Filtering to the larger bands strips out most managed-account noise and leaves a few hundred transactions a year that are genuinely worth reading.
Frequently asked questions
Which year had the most congressional stock trades?
2025, with 8,215 disclosed transactions, ahead of 2020's 7,003. 2026 is a partial year in this data set.
Do Republicans or Democrats trade more?
By filing count the record is close: 29,430 transactions from 196 Republicans and 27,656 from 148 Democrats, which works out to more filings per Democratic member.
Does the House or the Senate file more trades?
The House, by a wide margin: 46,096 transactions from 275 representatives versus 11,166 from 77 senators, partly because there are more than four times as many House members.
Hillradar AI republishes public STOCK Act disclosures for research and education. Figures come from the official filings as collected in our database on the date shown; filings can be amended by the filer. Nothing here is investment advice.