The 15 stocks traded by the most members of Congress
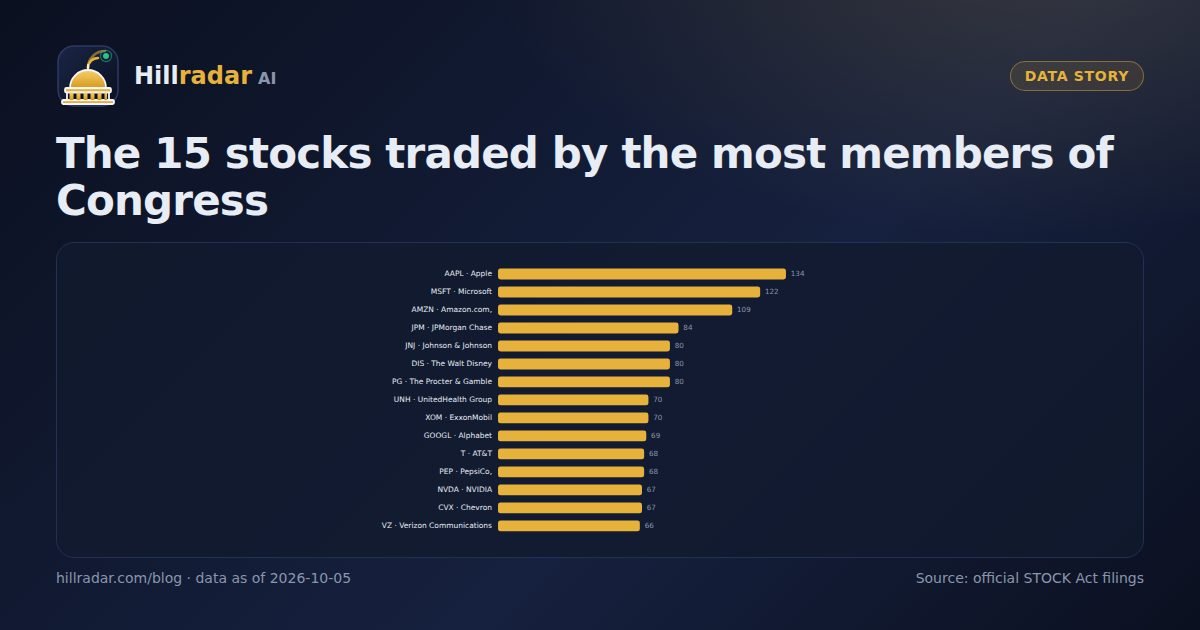
Counting transactions rewards whoever trades most. Counting lawmakers tells you which companies sit in the widest range of congressional portfolios. Here is that list, with buys and sells for each.
The ranking
| # | Stock | Lawmakers | Transactions | Buys | Sells |
|---|---|---|---|---|---|
| 1 | AAPL Apple Inc. | 134 | 805 | 381 | 424 |
| 2 | MSFT Microsoft Corporation | 122 | 883 | 453 | 430 |
| 3 | AMZN Amazon.com, Inc. | 109 | 430 | 265 | 165 |
| 4 | JPM JPMorgan Chase & Co. | 84 | 279 | 145 | 134 |
| 5 | JNJ Johnson & Johnson | 80 | 305 | 174 | 131 |
| 6 | DIS The Walt Disney Company | 80 | 274 | 144 | 130 |
| 7 | PG The Procter & Gamble Company | 80 | 260 | 151 | 109 |
| 8 | UNH UnitedHealth Group Incorporated | 70 | 291 | 133 | 158 |
| 9 | XOM ExxonMobil Holdings Corporation | 70 | 268 | 117 | 151 |
| 10 | GOOGL Alphabet Inc. | 69 | 221 | 112 | 109 |
| 11 | T AT&T Inc. | 68 | 261 | 142 | 119 |
| 12 | PEP PepsiCo, Inc. | 68 | 215 | 97 | 118 |
| 13 | NVDA NVIDIA Corporation | 67 | 433 | 248 | 185 |
| 14 | CVX Chevron Corporation | 67 | 218 | 103 | 115 |
| 15 | VZ Verizon Communications Inc. | 66 | 212 | 91 | 121 |
What the list says
It is, almost exactly, the list of the largest and most widely held US companies. That is the first and most important lesson: a stock being popular in Congress mostly means it is popular everywhere. Apple, Microsoft, Amazon, Alphabet, JPMorgan, Johnson & Johnson, Procter & Gamble, Disney, UnitedHealth and ExxonMobil are index staples, and they appear in congressional portfolios for the same reason they appear in pension funds.
The more interesting signal is in the buy/sell balance. Microsoft has the most transactions (883) and they split almost evenly. Amazon leans heavily to purchases (265 buys to 165 sells), as does NVIDIA (248 to 185). UnitedHealth and ExxonMobil lean the other way, with more sales than purchases across the period.
The same list, 2025 onwards
Restrict the window to trades since January 2025 and the top of the list barely moves, but NVIDIA jumps from 13th to 4th, and Alphabet overtakes JPMorgan. Shifts like that, where a company suddenly appears in many more portfolios than before, are exactly what Hillradar AI's activity-cluster view is built to surface, with the lawmakers and dates behind each one.
How to use this responsibly
- Breadth (number of lawmakers) is a better measure of 'congressional interest' than raw transaction counts, which one active filer can dominate.
- Large-cap names dominate because they dominate every portfolio; look for companies that are unusual for Congress, not the usual ones.
- Buy/sell imbalances are informative but say nothing about why; the filings carry no reasons.
- Every count here is of disclosed transactions, with the 45-day lag and the amendment caveat that applies to all STOCK Act data.
The company pages on Hillradar AI show, for any ticker, every lawmaker who has traded it with dates and amount ranges. Create a free account to look one up.
Reading the list by sector
Group the fifteen names and the shape of congressional portfolios appears. Technology supplies five (Apple, Microsoft, Amazon, Alphabet, NVIDIA) and the two with the most transactions. Consumer staples add Procter & Gamble and PepsiCo; healthcare Johnson & Johnson and UnitedHealth; energy ExxonMobil and Chevron; telecoms AT&T and Verizon; financials JPMorgan; and media Disney. It is a diversified blue-chip portfolio of the kind a wealth manager would build for a cautious client, which is consistent with how most of these accounts are run.
Turnover versus breadth
Microsoft has 883 transactions from 122 lawmakers, about 7.2 per holder, while Apple has 805 from 134, or 6.0. NVIDIA stands out with 433 transactions from only 67 lawmakers, 6.5 each, the highest turnover in the top fifteen. High turnover in one stock usually means a small number of very active accounts trading it repeatedly, so when NVIDIA appears in a cluster it is worth checking whether the buyers are new to the stock or the same frequent traders.
How to use company data on a tracker
Open the company page, sort by trade date and look at three things: whether purchases cluster in time, whether the buyers are lawmakers who do not normally hold the stock, and what amount bands they used. A dozen $1,001–$15,000 purchases spread over a year by the same two managed accounts is background noise. Four purchases in a month by four different members, two of them in the $50,001–$100,000 band or above, is the kind of pattern Hillradar AI's AI Scanning flags automatically. Either way, the filing dates tell you how stale the information already is.
Frequently asked questions
Which stock has the most members of Congress trading it?
Apple (AAPL): 134 different lawmakers have disclosed at least one Apple transaction since 2014, with 805 transactions in total.
Which stock has the most congressional transactions overall?
Microsoft (MSFT), with 883 disclosed transactions by 122 lawmakers.
Are these stocks being bought or sold?
Both. For most large-cap names buys and sells are close to balanced, which is what you expect from long-term holdings being rebalanced. A few, such as Amazon and NVIDIA, show noticeably more purchases than sales in the record.
Hillradar AI republishes public STOCK Act disclosures for research and education. Figures come from the official filings as collected in our database on the date shown; filings can be amended by the filer. Nothing here is investment advice.