Why congressional stock trades are reported as ranges, and how to use them anyway
The amount column is the most quoted and most misunderstood part of a congressional disclosure. This guide explains the bands and shows where real filings fall.
The ten bands
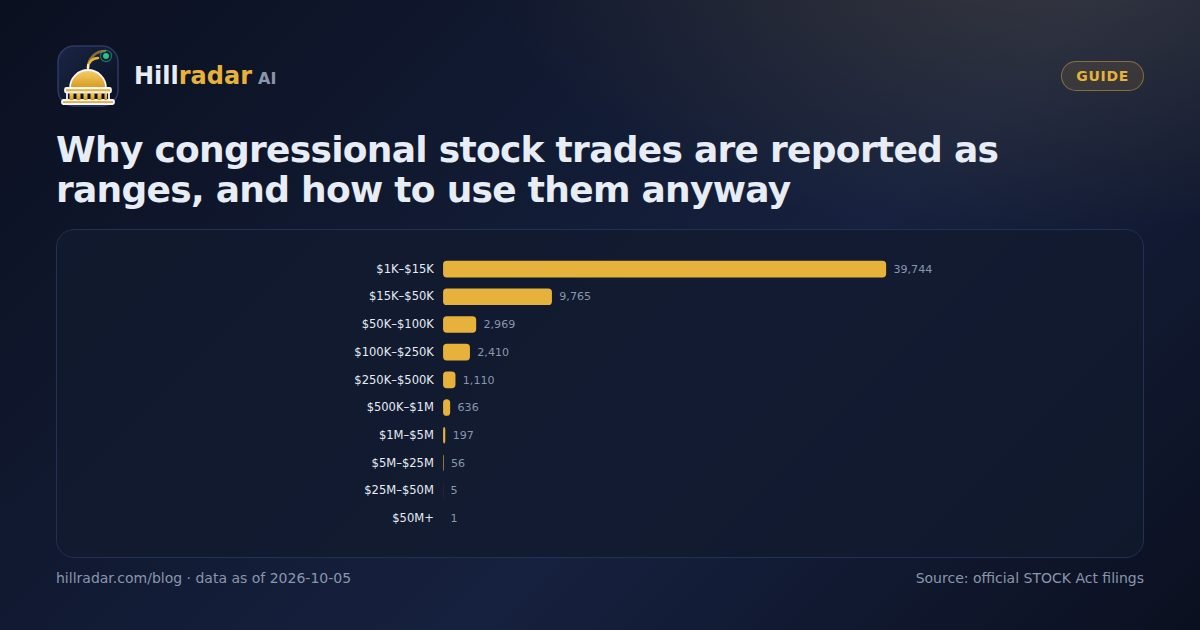
The bands come from the Ethics in Government Act and were carried into the STOCK Act unchanged. 69% of all congressional transactions fall in the smallest band, $1,001–$15,000. Another 17% are $15,001–$50,000. Everything above $250,000 together makes up 3.5% of filings, and transactions over $5 million are rare (62 in twelve years).
Why ranges exist
Congress designed the disclosure system to reveal conflicts, not net worth. A band is enough to show that a member has a meaningful position in a company they regulate, without publishing a precise personal balance sheet. Whether that trade-off still makes sense is a live political debate; for data users it is simply the constraint to design around.
The midpoint mistake
The most common error in coverage of congressional trading is to treat a range as its midpoint, then sum midpoints into a headline figure. Two problems: the widest bands span a factor of five or more, and the distribution inside a band is not uniform. A $1,001–$15,000 filing is far more likely to be $2,000 than $14,000, because small periodic rebalances dominate that band. Midpoint sums therefore overstate small portfolios and understate large ones.
What ranges are still good for
- Relative size within one lawmaker's history: a $250K+ purchase from someone who usually files $1K–$15K trades is unusual by definition.
- Screening: filtering to $100,001 and above removes almost all managed-account noise.
- Direction: a large sale band followed by a small buy band tells a story even without exact numbers.
- Aggregation across many filers: upper-bound totals by company or sector rank consistently even if their absolute level is inflated.
A worked example
Suppose a representative files three purchases of the same stock on one day: $15,001–$50,000, $15,001–$50,000 and $1,001–$15,000. The honest statement is "between $31,003 and $115,000", with an upper bound of $115,000. Saying "about $73,000" (the midpoint sum) adds no information and invites a false sense of precision. Hillradar AI's filters let you set a minimum band so you decide what counts as material.
For the full field-by-field walkthrough of a filing, see how to read a Periodic Transaction Report.
Where the bands came from
The ranges predate the STOCK Act by decades. The Ethics in Government Act of 1978 created annual financial disclosure for federal officials and chose bands as a compromise between transparency and privacy; later amendments added the upper tiers as portfolios grew. When Congress added transaction reporting in 2012 it reused the same categories so that PTRs and annual reports would be comparable. Proposals to require exact amounts, or at least narrower bands at the low end where 69% of transactions sit, have been introduced several times without passing.
The systematic bias in band data
Because managed accounts generate many small trades, the lowest band is crowded near its floor, while the rare large transactions tend to sit anywhere in their wide bands. Any method that assigns one number per band will therefore overstate small portfolios and understate the dispersion of large ones. The upper-bound approach at least errs in a known direction. For comparisons between lawmakers, the fairest measures are counts within bands ("how many trades above $100,000") rather than summed dollar figures of any kind.
Practical filters that work
- Minimum band $50,001 removes about 86% of all transactions and nearly all routine rebalancing.
- Minimum band $250,001 leaves 2,005 transactions across twelve years, a list short enough to read in full.
- Band jumps: a member's first-ever filing in a band two steps above their usual one is a reliable "look here" flag.
- Buy/sell asymmetry by band: large sells with small buys usually mean an exit; the reverse means accumulation.
Frequently asked questions
What are the STOCK Act amount ranges?
$1,001–$15,000; $15,001–$50,000; $50,001–$100,000; $100,001–$250,000; $250,001–$500,000; $500,001–$1,000,000; $1,000,001–$5,000,000; $5,000,001–$25,000,000; $25,000,001–$50,000,000; and over $50,000,000.
Can you work out the exact amount of a congressional trade?
Not from the filing. Occasionally a member discloses an exact figure voluntarily, and share counts can sometimes be inferred from later annual reports, but for the vast majority of transactions only the band is public.
How does Hillradar calculate 'volume'?
As an upper bound: the top of each transaction's band, summed, and labelled as an estimate. Using midpoints would look more precise while being no more accurate.
Hillradar AI republishes public STOCK Act disclosures for research and education. Figures come from the official filings as collected in our database on the date shown; filings can be amended by the filer. Nothing here is investment advice.